tl;dr Tracing is a very powerful tool for software development, especially in robotics. Using Trace Compass and existing ROS instrumentation, I built an analysis that can show the path of a message through a ROS stack. This work can serve as a proof-of-concept for future endeavours.
- Introduction
- Message flow analysis
- Results/example
- Conclusion
- Future work
- Links
- Acknowledgements
- References
Introduction
Tracing can be invaluable when diagnosing complex systems, especially when problems are hard to reproduce using traditional tools. Robotics software development can benefit from tracing and the low-overhead analyses it can provide.
The overall goal of this project was to first look into where ROS could benefit from such analyses, and then work towards that.
This first section will introduce both ROS and Trace Compass for people familiar with only one (or none) of them. I will also talk about robotics and tracing in general. The second and third sections will present my work along with an example.
Finally, I will conclude and briefly talk about possible future work related to this project.
Context
ROS
Robot Operating System (ROS) is an open-source framework and a set of libraries and tools for robotics software development. Although it has “Operating System” in its name, it’s not really an OS!
Its main feature is probably the implementation of the publish-subscribe pattern. Nodes, which are modular “processes” designed to accomplish a specific task, can publish on, or subscribe to, one or more topics to send/receive messages. By launching multiple nodes (either from your own package or from a package someone else made), you can accomplish complex tasks!
Trace Compass
Eclipse Trace Compass is an open source trace viewer and analysis framework designed to solve performance issues. It supports many trace formats, and provides numerous useful analyses & views out of the box, such as the kernel resources and control flow views. Users can also use its API to implement their own analyses, which is what I did!
Topic
My initial objective was to look into where ROS development could benefit from tracing and subsequent analyses, and try to help with that.
Early on in this project, I considered targeting ROS 2. However, as it was still relatively new and less mature than ROS 1, I went with the latter.
Literature review & existing solutions
A presentation at ROSCon 2017, titled “Determinism in ROS – or when things break /sometimes/ and how to fix it…” exposed how ROS’ design does not guarantee determinism in execution. This is actually what piqued my curiosity at first, since I was a ROS user and had started to learn about tracing, and it eventually led to this project.
In this case, lack of determinism can be seen as merely a symptom. This led me to search for possible causes, one of which might be network/communications [1, 2, 3, 4, 5]. For latencies, which might lead to lack of determinism, critical path analyses can help identify the actual root cause [6, 7, 8, 9].
As for tools, many are distributed along with ROS to help users and developers. rqt_graph can create a graph of publisher/subscriber relations between nodes. It can also show publishing rates. Similarly, the ROS CLI tools (e.g. rostopic) can help debug basic pub/sub issues.
Other tools are available. The diagnostics package can collect diagnostics data for analysis. The performance_test package for ROS 2 can test the performance of a communications middleware.
However, all of the tools or solutions mentioned above cannot provide a view of the actual execution. Besides, the performance overhead of using higher-level log aggregators (e.g. as a ROS node) is non-negligible.
The tracetools package uses LTTng to instrument ROS for tracing. However, it does not offer analysis tools.
Trace Compass offers a control flow view, showing the state of threads over time. By selecting one particular thread, a user can launch a critical path analysis.
Message flow analysis
Motive and goal
As mentioned previously, time is one of the main concerns for robotics applications. Critical path analyses can make these anomalies stand out and help developers find the root cause.
My goal was therefore to make a ROS-specific analysis along these lines. I chose to build what I call a “message flow analysis.” Using tracetools and the ROS instrumentation, we can figure out which queues a message went through, how much time it spent in each one, and if it ended up being dropped. Also, by linking a message received by a subscriber to the next corresponding message that gets published by the same node, we can build a model of the message processing pipeline.
Approach
Prerequisites
To build this analysis, some information is needed on:
- connections between publishers and subscribers
- subscriber/publisher queue states
- network packet exchanges
We first need to know about connections between nodes. The ROS instrumentation includes a tracepoint for new connections. It includes the address and port of the host and the destination, with an address:port pair corresponding to a specific publisher or subscription.
We also need to build a model of the publisher and subscriber queues. To achieve this, we can leverage the relevant tracepoints. These include a tracepoint for when a message is added to the queue, when it’s dropped from the queue, and when it leaves the queue (either sent over the network to the subscriber, or handed over to a callback). We can therefore visualize the state of a queue over time!
Finally, we need information on network packet exchanges. Although this isn’t really necessary for this kind of analysis, it allows us to reliably link a message that gets published to a message that gets received by the subscriber. This is good when building a robust analysis, and it paves the way for a future critical path analysis based on this message flow analysis.
This requires us to trace both userspace (ROS) and kernel. Fortunately, we only have to enable 2 kernel events for this. It saves us a lot of disk space, since enabling many events can generate multiple gigabytes of trace data, even when tracing for only a few seconds! Also, as the rate of generated events increases, the overhead also increases. More resources have to be allocated to the buffers to properly process those events, otherwise they can get discarded or overwritten.
Method
In this sub-section, I’ll quickly go over some implementation details and explain how the analysis works!
Let’s start with some background on Trace Compass. It allows you to build analyses that depend on trace events, the output of other analyses, or both. Some analyses are used to create views to directly display processed data. However, we can use them as models that can be queried by other models or analyses. This abstraction was very useful when designing my final analysis and its dependencies.
The first analysis is the connections model. Using the new_connection events from tracetools, it creates a list of connections between two nodes on a certain topic and includes information about the endpoints.
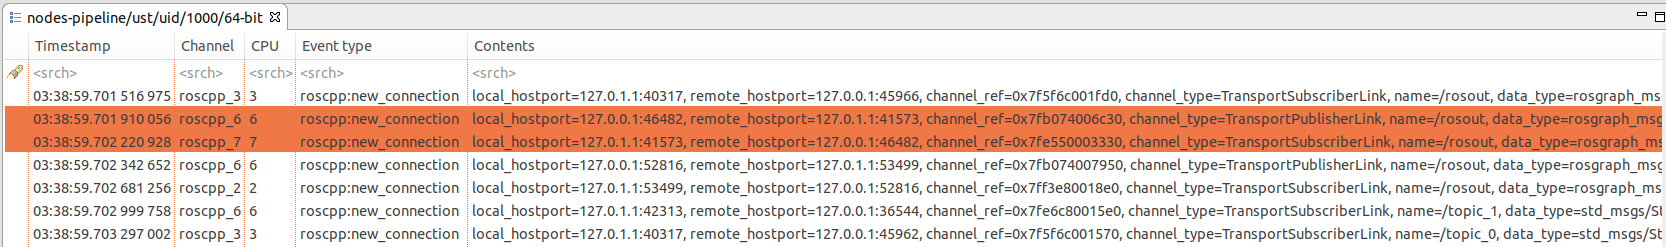
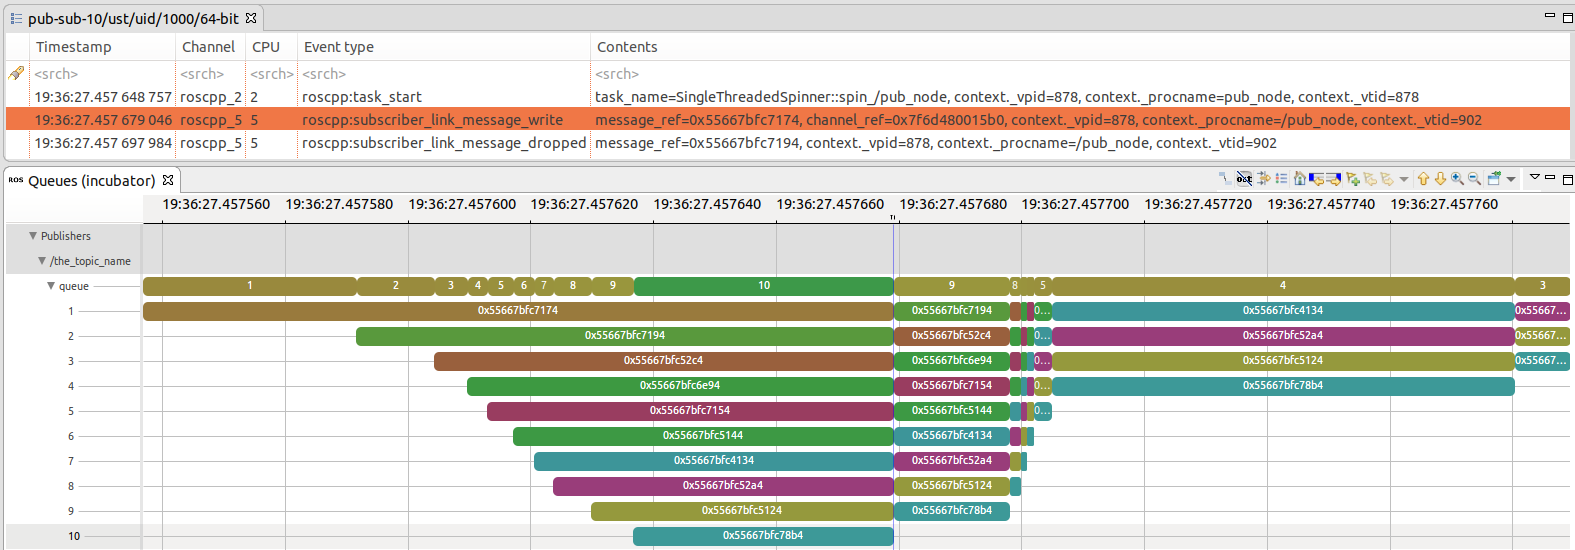
new_connection events. Highlighted are two events belonging to the same connection, on opposite endpoints.Another analysis is created to model queues over time. This uses three tracepoints, also from tracetools:
publisher_message_queuedorsubscription_message_queued, when a message is added to the queuesubscriber_link_message_writeorsubscriber_callback_start, when a message is successfully removed from the queue (i.e. sent over the network or processed by a callback)subscriber_link_message_droppedorsubscription_message_dropped, when a message is dropped from the queue
These events always include a reference to the associated message, so it can help validate the model.
The third analysis is for network packet exchange. This is the only analysis that needs kernel events: net_dev_queue for packet queuing and netif_receive_skb for packet reception. Fortunately, Trace Compass already does this! It matches sent and received packets. I only had to filter out SYN/FIN/ACK packets and those which were not associated with a known ROS connection. Then, from a node name, a topic name, and a timestamp at which a message was published, we can figure out when it went through the network, and link it to a message received by the subscription.
Finally, we can put everything together! The analysis uses the above analyses to reconstruct and display a message’s path accross queues, callbacks, and the network!
Results/example
To illustrate this, I wrote a simple “pipeline” test case. A first node periodically publishes messages on a topic. A second node does some processing and re-publishes them on another topic. A third node does the same, and a fourth and last node prints the contents of a message.

rqt_graph.From the view showing queues over time, the user can select an individual message by clicking on it, then hitting the Follow the selected message button.
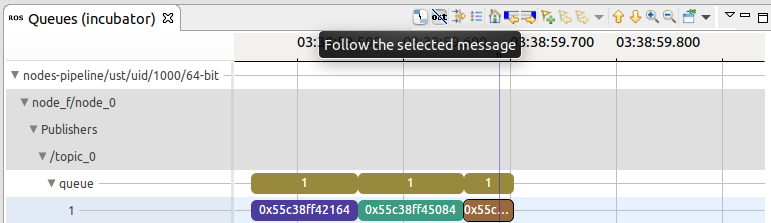
The message flow analysis – and all its dependencies – are run. The output can then be viewed in the corresponding view.
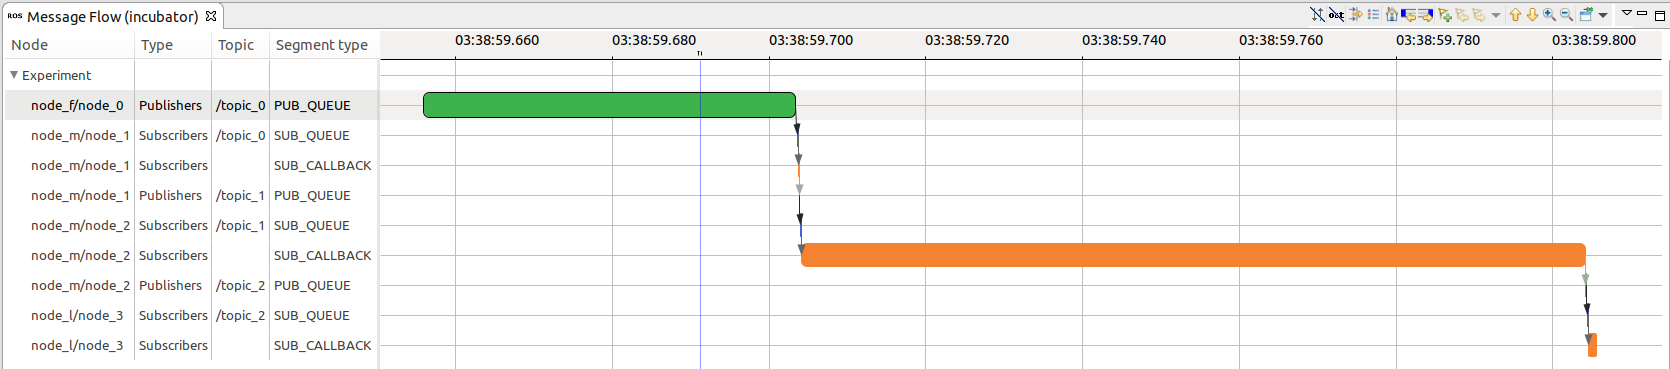
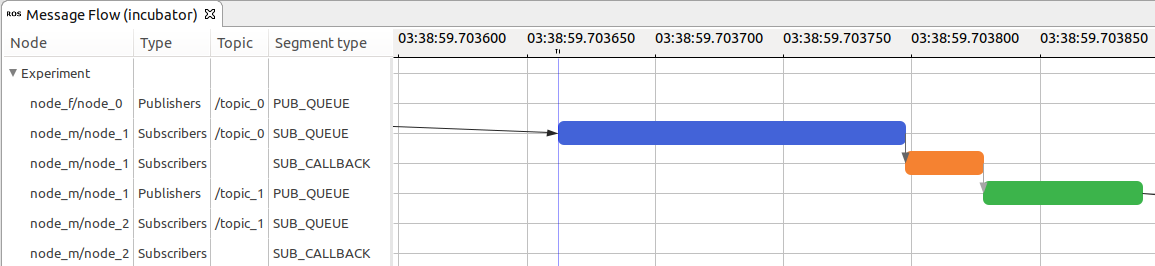
There it is! Some sections are hard to make out, so we can zoom in.
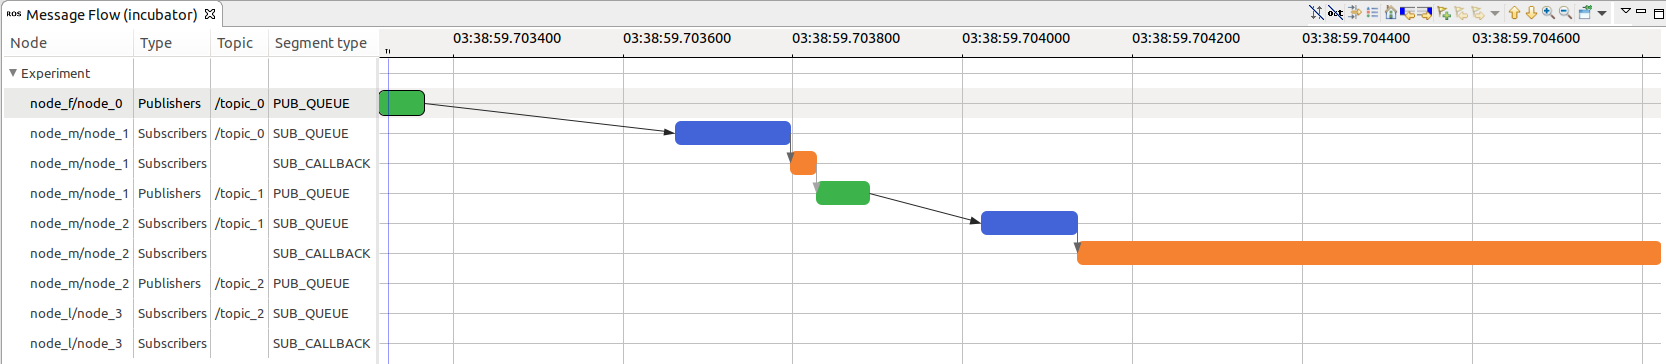
We can see three main states: publisher queue, subscriber queue, and subscriber callback. Of course, the transition represented by the darker arrows between the publisher queue and subscriber queue states includes the network transmission.
However, going back to the original perspective, two states clearly stand out. The first (green) state represents the time spent in the first node’s publisher queue, waiting for other nodes to be ready in order to transmit the message. The biggest state, in orange, represents the time spent in a callback inside the third node. We can hover over the state to get more info.
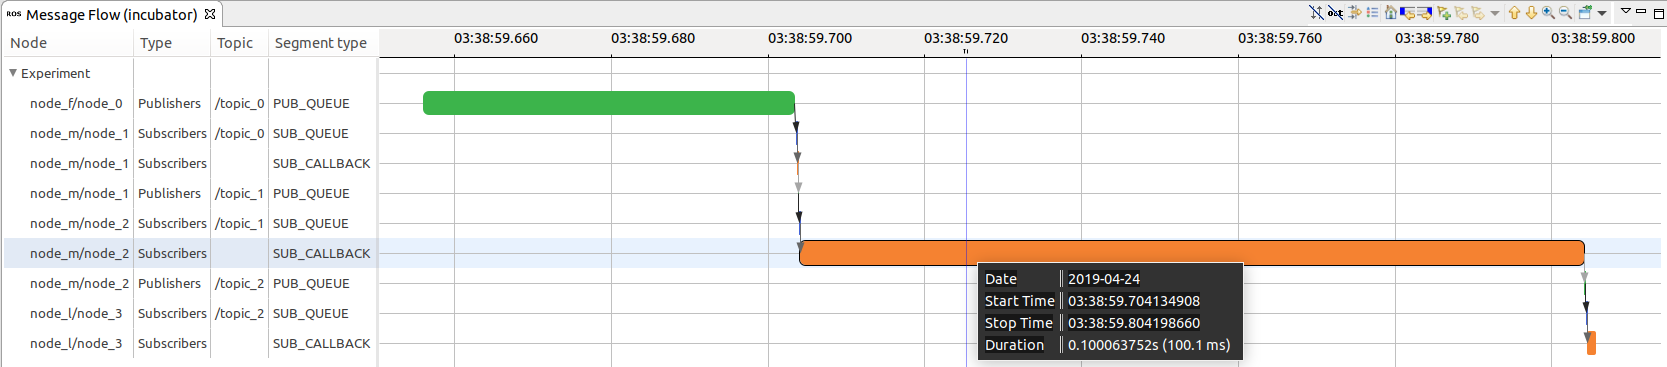
We can see that the message spent around 100 milliseconds in the callback before the next related message was sent to the following publisher queue. In this case, it can be explained by looking at the node’s source code!
void callbackFunction(const std_msgs::String::ConstPtr& msg) {
    std_msgs::String next_msg;
    int payload = get_payload(msg->data);
    int new_payload = payload + pow(payload, 2);
    if (node_i == 2) {
        ros::Duration(0.1).sleep(); // <---------
    }
    next_msg.data = MSG_CONTENT_PREFIX + std::to_string(new_payload);
    pub.publish(next_msg);
}
Conclusion
In conclusion, tracing is a very powerful tool for robotics software development. Lack of determinism was identified as a symptom, and timing was chosen as an analysis topic.
Using existing ROS instrumentation, I worked towards providing insight into the timewise execution of a ROS software stack. The result, a Trace Compass analysis for ROS, can serve as a proof-of-concept for future endeavours.
Future work
Many elements could be improved, and many new paths could be explored.
First and foremost, other than not supporting UDP and not explicitly supporting namespaces, there are many limitations and simplifications with the current implementation, as most of the traces I used were taken from executions of (very synthetic) test cases.
To link a message between two endpoints, this selects the first corresponding TCP packet that is queued (net_dev_queue) after the subscriber_link_message_write event, and then selects the next subscription_message_queued event after the matching netif_receive_skb event. This assumption about the sequence of events might not be always valid. Also, it has not been tested with messages bigger than the maximum payload size of a TCP packet.
Furthermore, callbacks were considered as the only possible link between two messages (received & published). Nodes might deal with callbacks and message publishing separately, e.g. when publishing at a fixed rate independently of the received messages. In the same sense, message flows do not have to be linear! In other words, one incoming message can turn into multiple outgoing messages.
Also, Trace Compass can easily aggregate traces from multiple hosts. This is very relevant for robotics systems, and thus would be a great avenue to explore.
Finally, as mentioned previously, the message flow analysis could be extended to provide a critical path analysis. This would provide more information about what actually happened while a message was waiting in a queue.
Links
- My fork of the original instrumentation fork. I improved and fixed some small things, including adding information about latched messages.
- My fork of the original
tracetoolspackage. - Repo with a few test traces and a
.reposfile to easily setup a workspace to trace ROS. - Documentation on how to install features from the Trace Compass Incubator, which includes support for ROS traces, the analyses mentioned in this post, and more.
Acknowledgements
This project was done as part of the UPIR program for undergraduate research at Polytechnique Montréal, and was supervised by Michel Dagenais. I thank him for his great input!
I would also like to thank Matthew Khouzam and Geneviève Bastien for their help and advice, and Ingo Lütkebohle for his commentary on the need for tracing in robotics.
References
[1] C. S. V. Gutiérrez, L. U. S. Juan, I. Z. Ugarte, and V. M. Vilches, “Real-time Linux communications: an evaluation of the Linux communication stack for real-time robotic applications,” arXiv:1808.10821 [cs], Aug. 2018.
[2] C. S. V. Gutiérrez, L. U. S. Juan, I. Z. Ugarte, I. M. Goenaga, L. A. Kirschgens, and V. M. Vilches, “Time Synchronization in modular collaborative robots,” arXiv:1809.07295 [cs], Sep. 2018.
[3] C. S. V. Gutiérrez, L. U. S. Juan, I. Z. Ugarte, and V. M. Vilches, “Time-Sensitive Networking for robotics,” arXiv:1804.07643 [cs], Apr. 2018.
[4] C. S. V. Gutiérrez, L. U. S. Juan, I. Z. Ugarte, and V. M. Vilches, “Towards a distributed and real-time framework for robots: Evaluation of ROS 2.0 communications for real-time robotic applications,” arXiv:1809.02595 [cs], Sep. 2018.
[5] Y.-P. Wang, W. Tan, X.-Q. Hu, D. Manocha, and S.-M. Hu, “TZC: Efficient Inter-Process Communication for Robotics Middleware with Partial Serialization,” arXiv:1810.00556 [cs], Oct. 2018.
[6] F. Giraldeau and M. Dagenais, “Wait Analysis of Distributed Systems Using Kernel Tracing,” IEEE Transactions on Parallel and Distributed Systems, vol. 27, no. 8, pp. 2450–2461, Aug. 2016.
[7] F. Doray and M. Dagenais, “Diagnosing Performance Variations by Comparing Multi-Level Execution Traces,” IEEE Transactions on Parallel and Distributed Systems, pp. 1–1, 2016.
[8] P.-M. Fournier and M. R. Dagenais, “Analyzing blocking to debug performance problems on multi-core systems,” ACM SIGOPS Operating Systems Review, vol. 44, no. 2, p. 77, Apr. 2010.
[9] C.-Q. Yang and B. P. Miller, “Critical path analysis for the execution of parallel and distributed programs,” in [1988] Proceedings. The 8th International Conference on Distributed, San Jose, CA, USA, 1988, pp. 366–373.